03 / Description
Maple Market
A visual explorer for big Canadian stocks: TSX companies as planets, a heatmap, and plain-English tools for compare, dividends, and compound growth.
- Next.js
- React Three Fiber
- Three.js
- Recharts
- Zustand
Problem
A table of tickers hides the shape of a market. Company size, the past year, and how much you pay for each dollar of profit should be readable at a glance, in plain English, without a trading terminal.
Approach
Maple Market draws large TSX names as a sky. Bigger planets are bigger companies. Green is a stronger past year, red a weaker one, and distance from the sector sun is the price you pay for each dollar of profit. Search and the sector filters find a name. Clicking a planet opens the ticker, the price, and the past-year change.
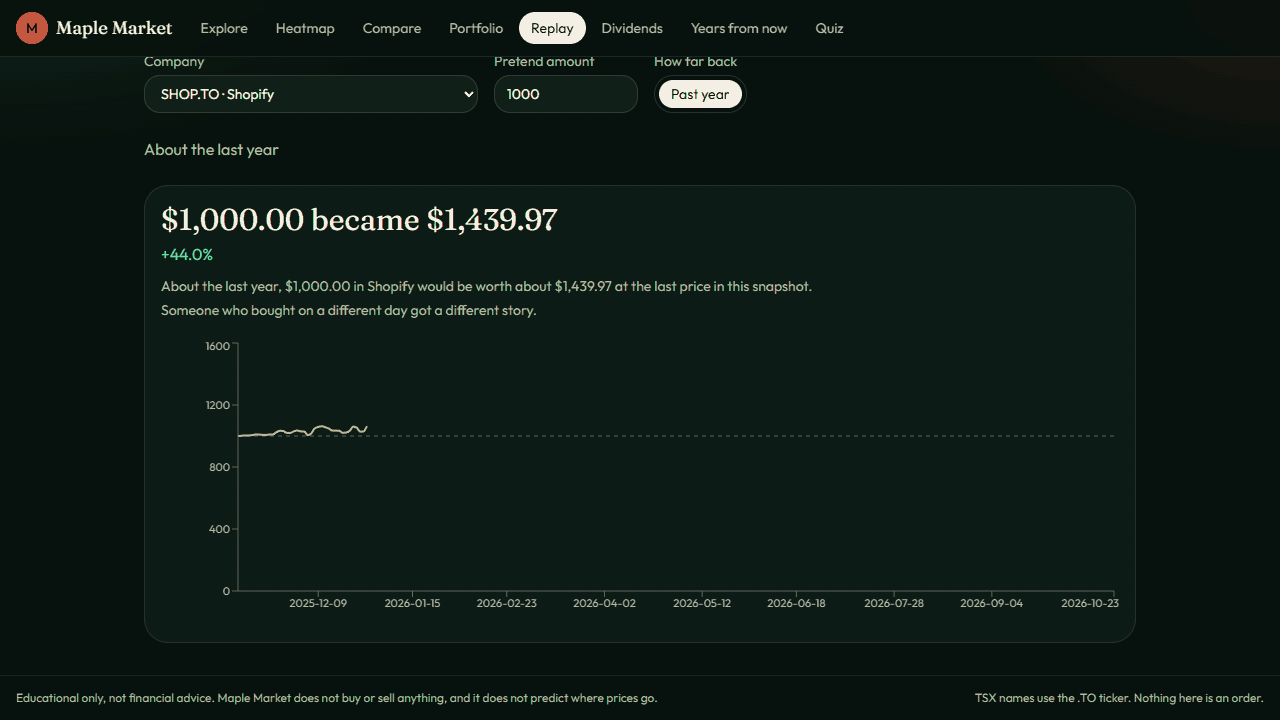
The same names are also a treemap heatmap. Compare lines up to three companies as a report card. Beside that: a practice portfolio, a replay of prices already on record, a dividend reinvestment sketch, a compound-growth band, and a short quiz.
The public site is labeled demo data. It does not buy or sell anything, and it does not predict where prices go.
Key technical decision
Put size, past-year colour, and valuation in a React Three Fiber scene instead of columns. The chart pages use Recharts. Zustand holds what is selected.
Result
The explorer is live at maplemarket.zainrizvi.ca.